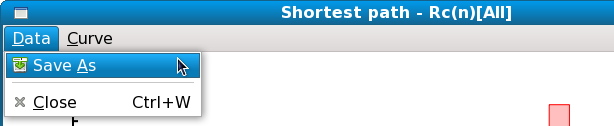
Results computed by I.S.A.A.C.S. can be easily saved using the standard copy and paste method (for the results presented in the main I.S.A.A.C.S. window) or using the 'Data menu' [Fig. 4.29].
Figure 4.29:
The 'Data' menu of the graph window in the I.S.A.A.C.S. program.
|
|
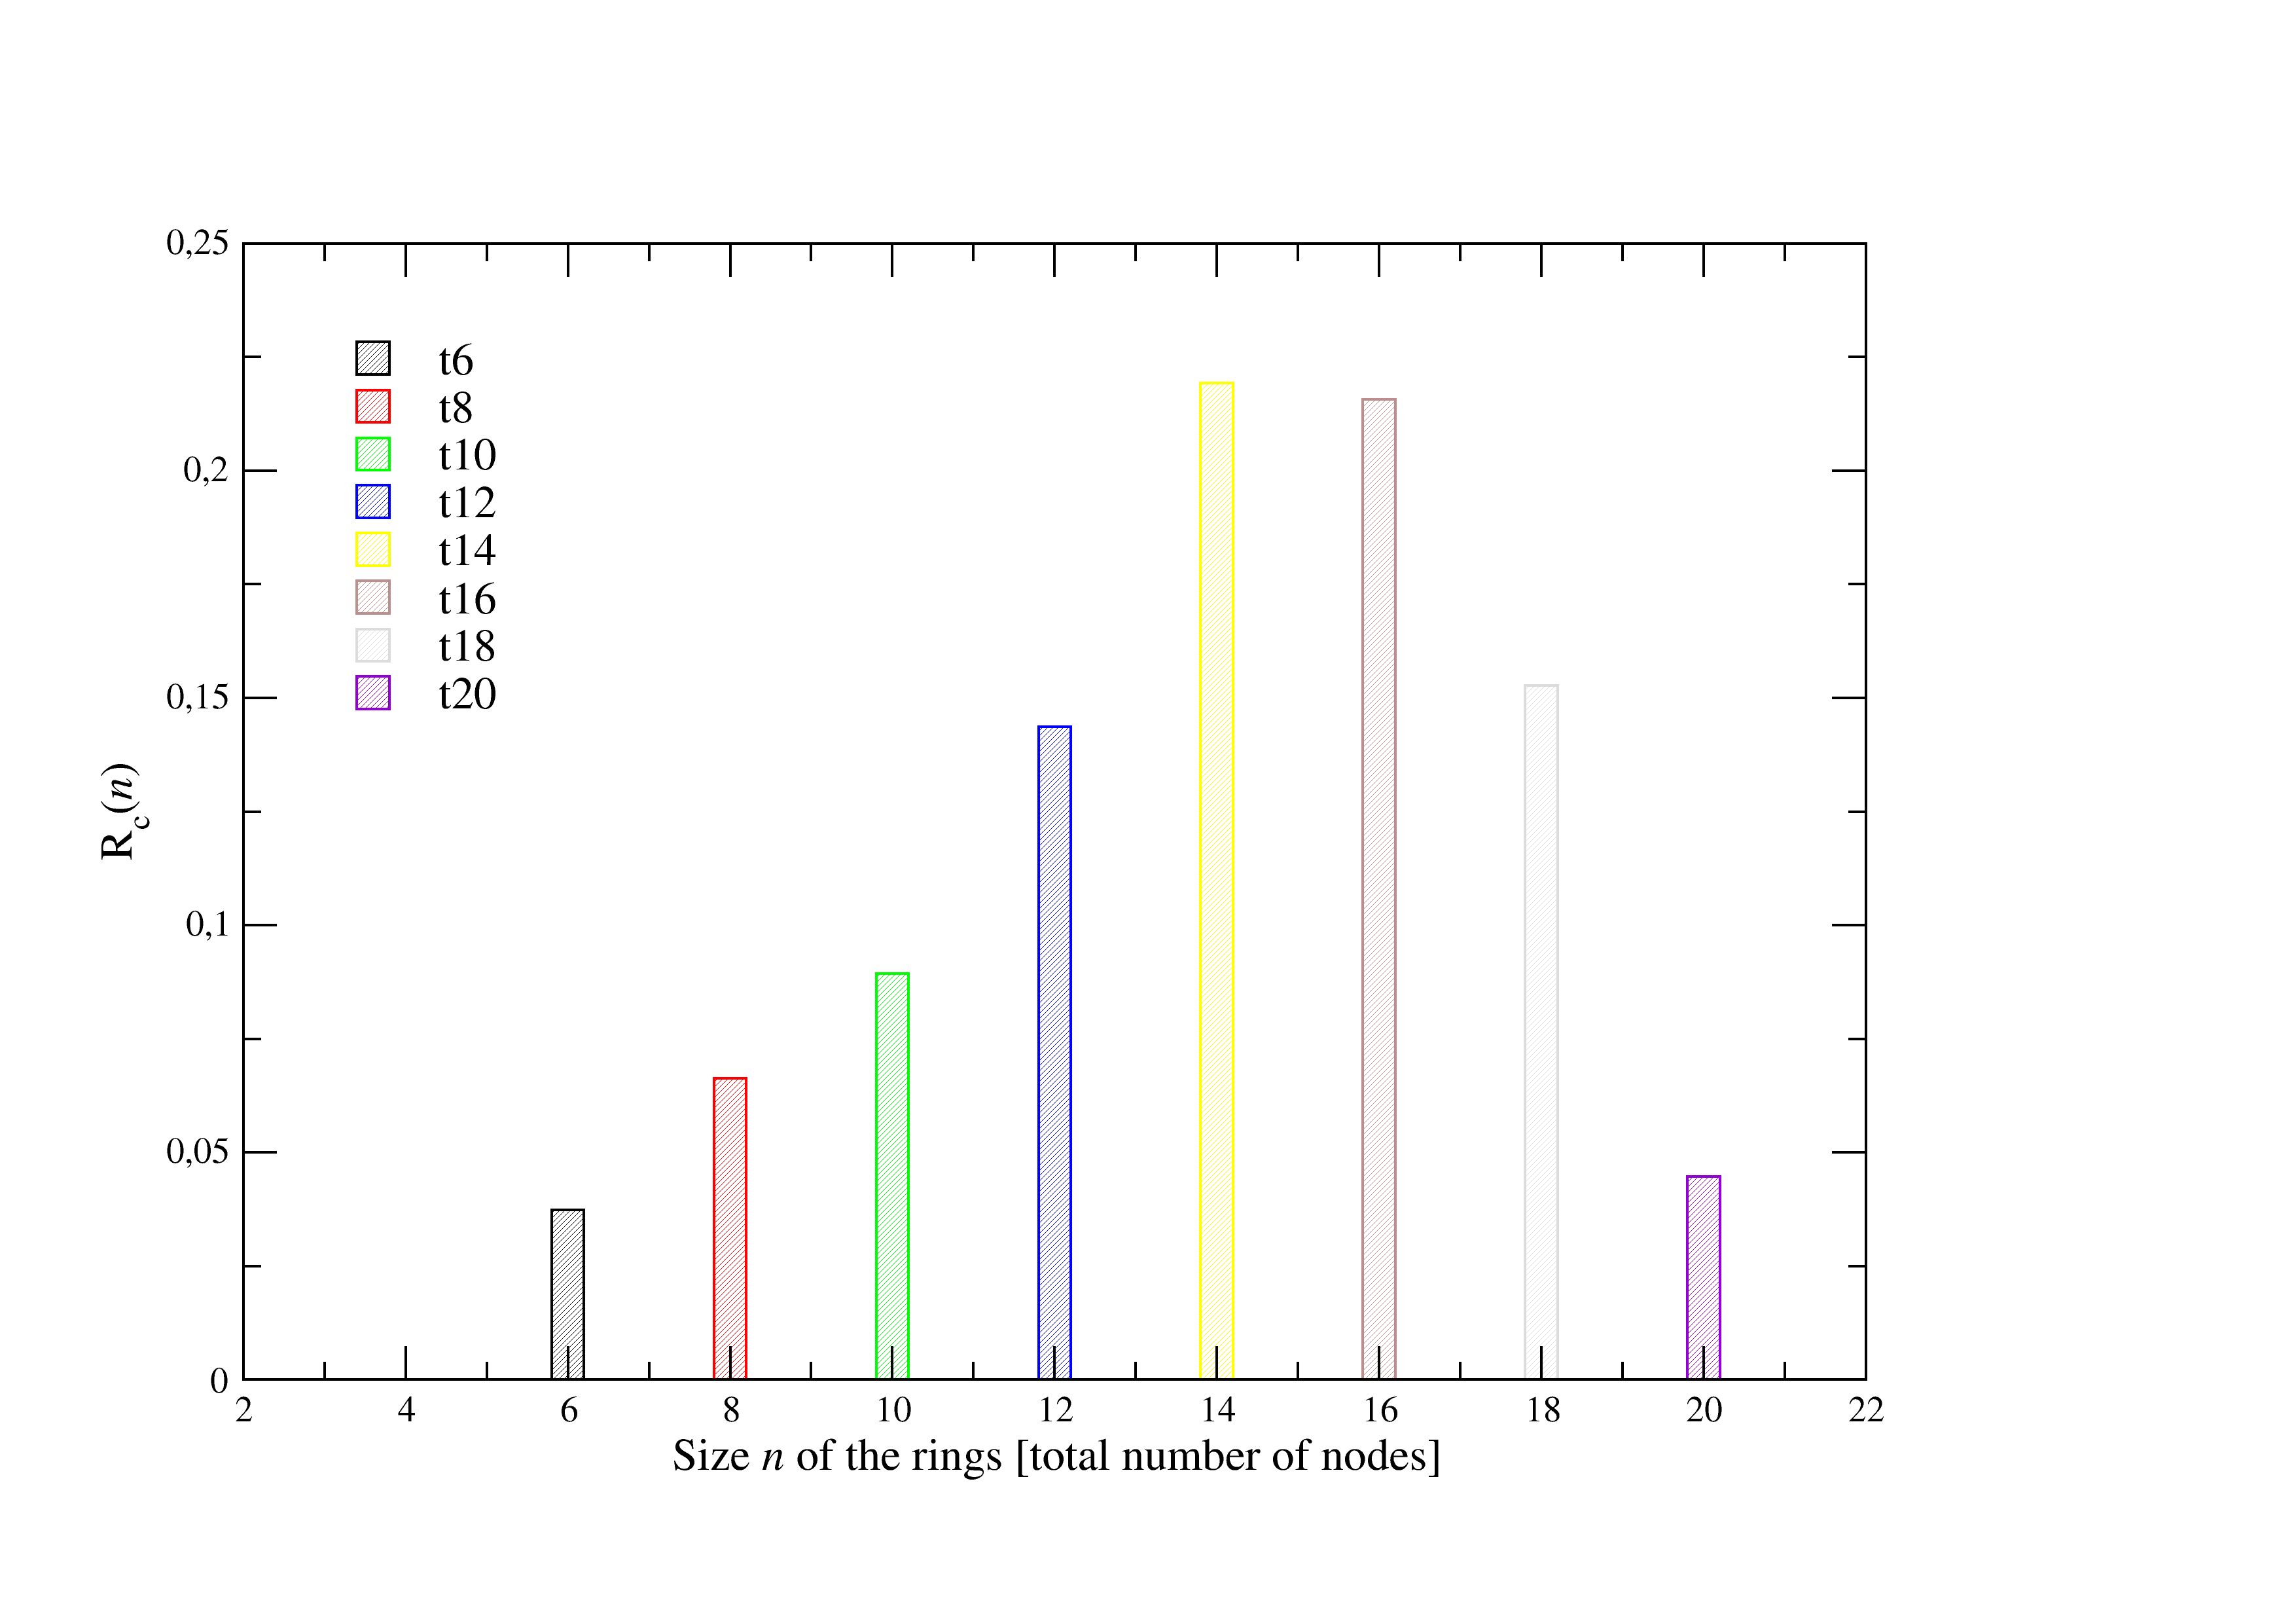
Also the user has the possibility to export data either in a raw ASCII format (simple two columns file with x and y) or in the Xmgrace format which can be used immediately in the Grace WYSIWYG 2D plotting tool [28] for a further analysis.
Figure 4.30:
Illustration of the utilization of the Xmgrace export filter in the I.S.A.A.C.S. program.
|
|
Figure [Fig. 4.30] shows the data immediately saved from the results presented in figure [Fig. 4.23] using the Xmgrace export filter of the I.S.A.A.C.S. program.
Note that if more than one data sets are presented on the same graph window, then all data sets will be written in the same file when saving the data.
Thus, for a particular calculation, if all data sets are added to the graph window using the data plot editing tool [Fig. 4.26], then all the data result of this analysis can be saved at once.
This is true for both ASCII and Xmgrace file formats.
Sébastien Le Roux
2011-02-26