When a particular structural characteristic is computed it can be directly displayed in the main I.S.A.A.C.S. windows [Fig. 3.1].
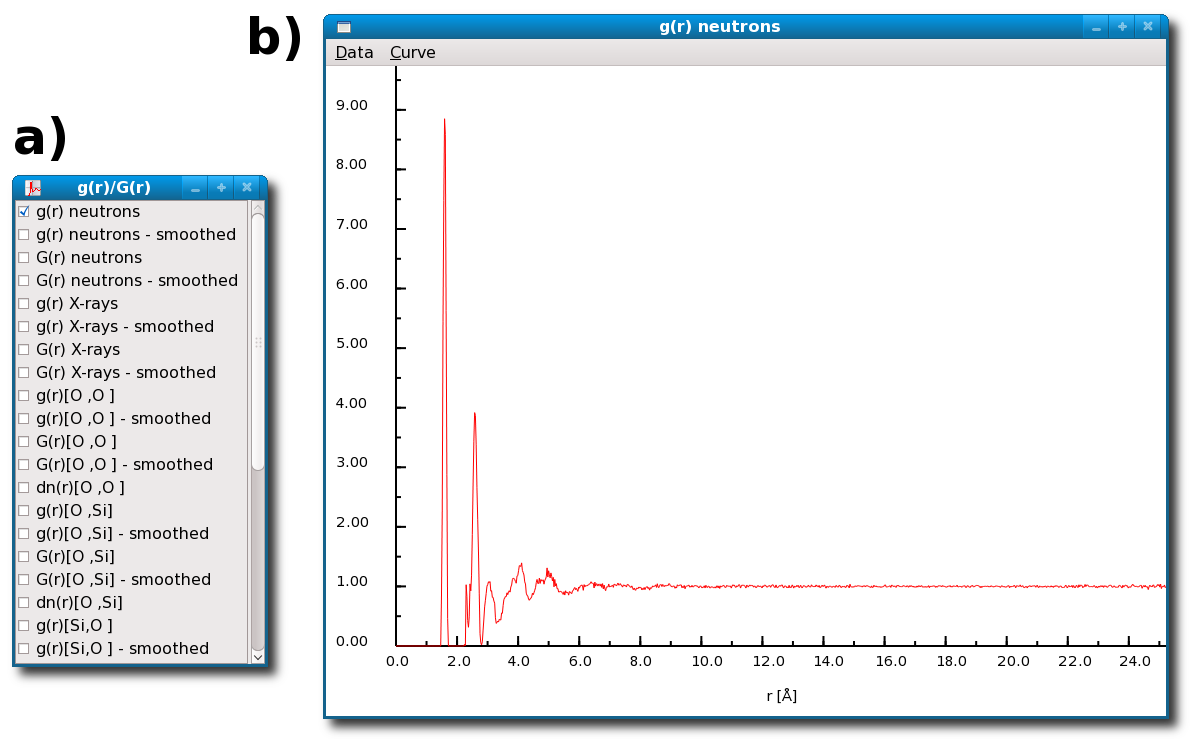
In addition the visualization mode of most of the computed characteristics can be controlled via interactive menus such as the one presented in figure [Fig. 4.21-a].
When a button in an interaction menu is activated [Fig. 4.21-a] the corresponding result is instantaneously displayed as a smooth curve or a histogram [Fig. 4.21-b, 4.22, 4.23, 4.24] depending on the nature of the computed structural characteristic.
Figure 4.21:
Results of the calculation of the radial distribution functions for glassy SiO2 by the I.S.A.A.C.S. program: the interaction box a) allows to display the computed RDFs, b) shows the total radial distribution function obtained for SiO2 glass in case of neutrons diffraction.
The RDF shows a first sharp peak position at 1.6 Å reflecting the presence of well defined Si(O4) tetrahedra in the glass.
The second RDF peak reflects the correlations between O atoms sitting on the vertices of those tetrahedra.
|
|
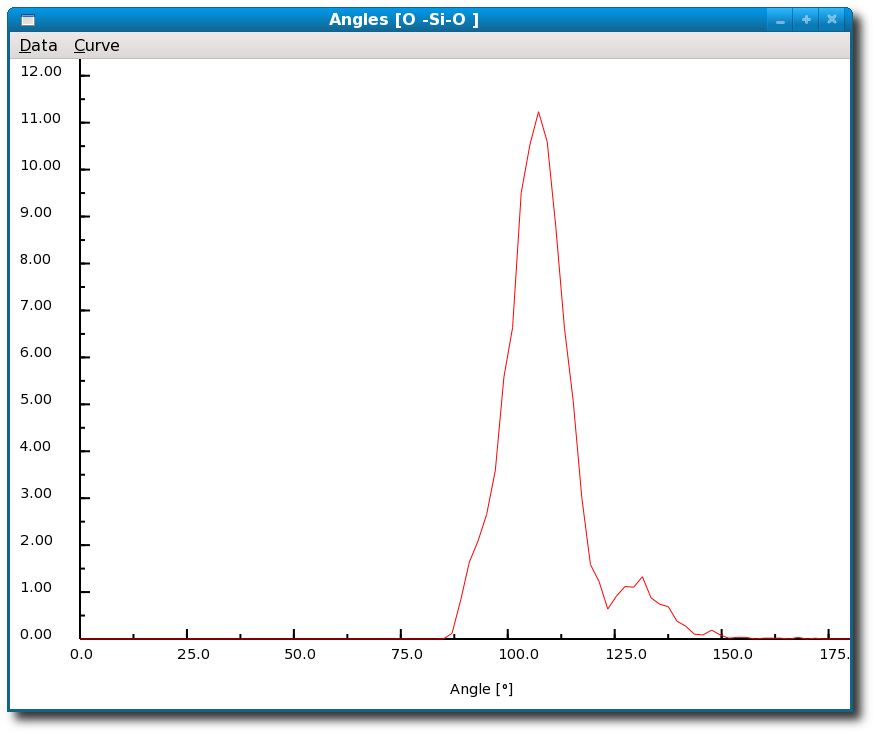
Figure 4.22:
Results from the calculation of the angle distribution for glassy SiO2 by the I.S.A.A.C.S. program: the figure represents the distribution of the bond angles (O-Si-O) computed and immediately displayed using I.S.A.A.C.S.
In SiO2 glass the O-Si-O angle distribution peaks at about 109o as may be expected for tetrahedral Si-O coordination.
|
|
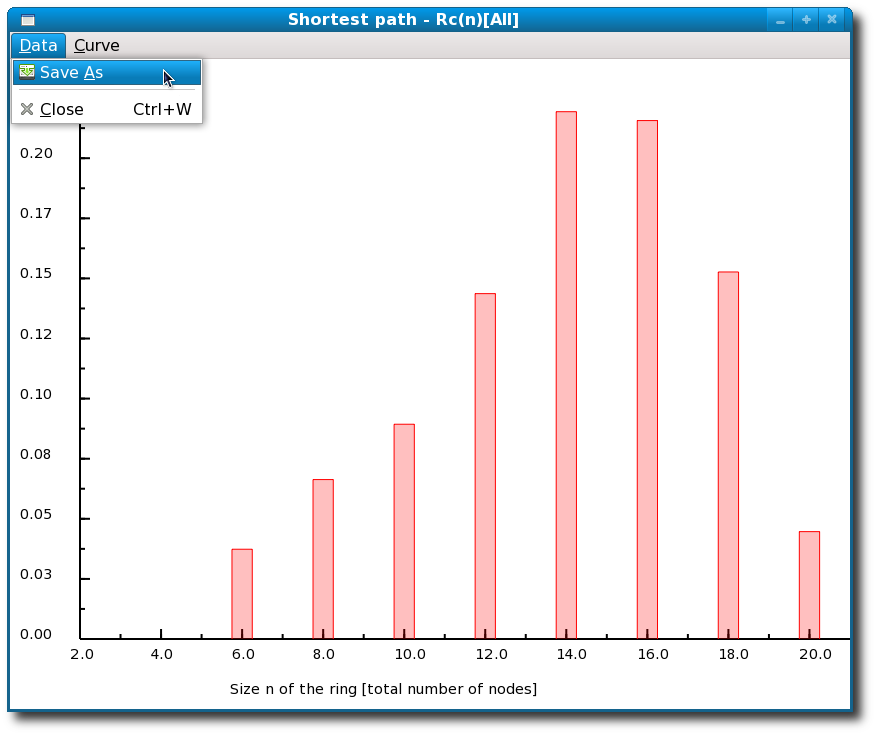
Figure 4.23:
Ring statistics for silica glass as computed by I.S.A.A.C.S.
These results present the average number of rings per atom in the simulation box for a maximum ring size fixed to 20 atoms. Note if the number of rings is normalized per Si(O4) unit and not per atom the "ring size" would drop by a factor of two, i.e. the distribution would peak around rings made of seven Si(O4) units.
|
|
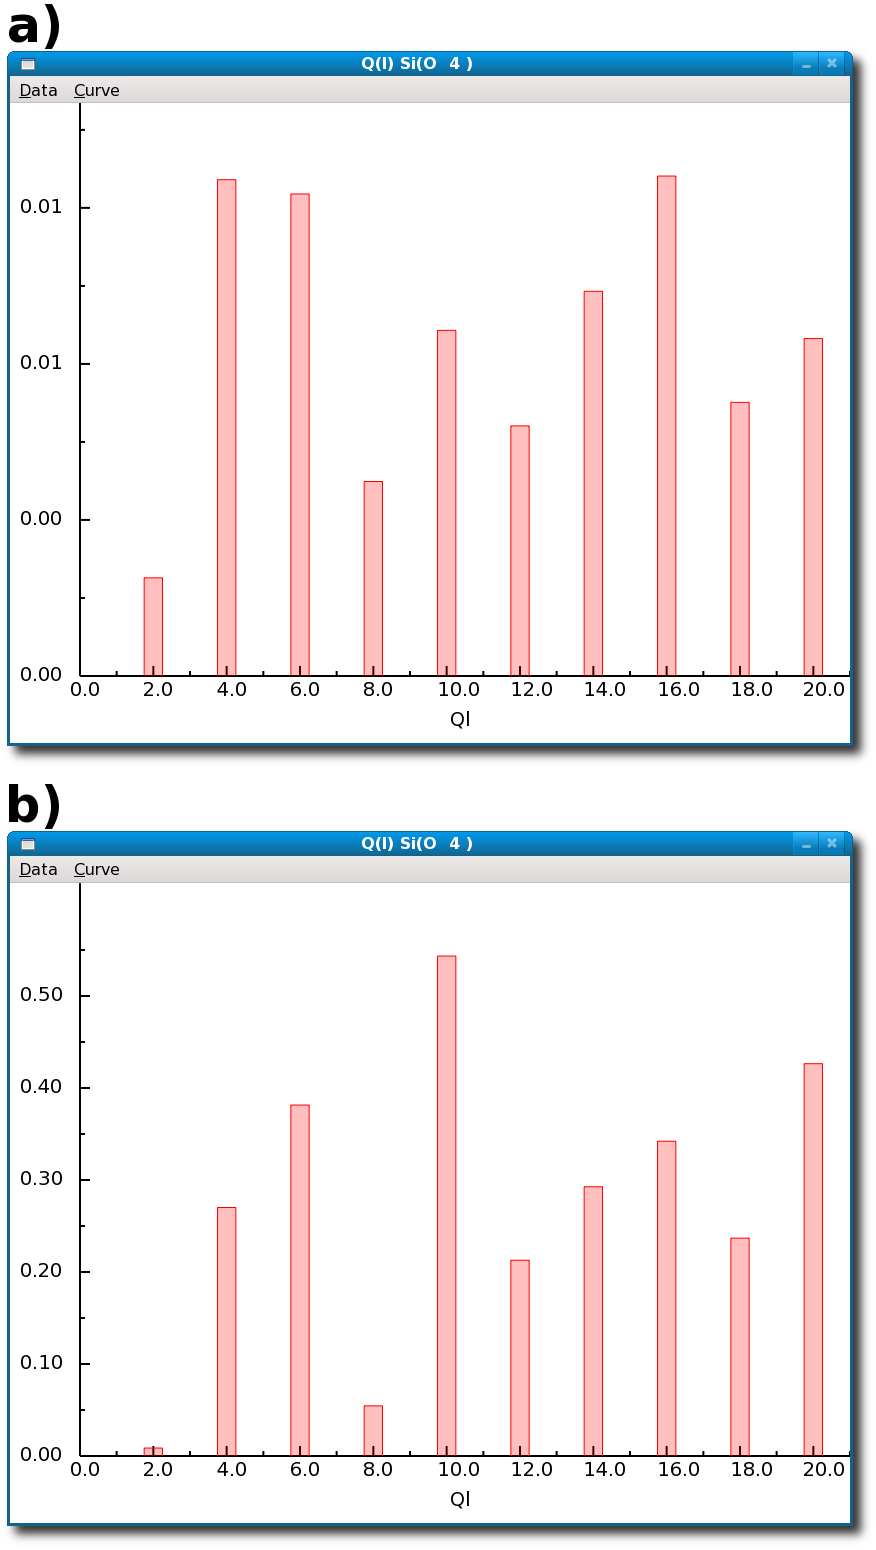
Figure 4.24:
Results of the calculation of the spherical harmonics as local order parameters for SiO2 glass by the I.S.A.A.C.S. program: a) average Ql computed for the Si(O4) environments (distorted tetrahedra) in glassy SiO2, compared with b) average Ql computed for the Si(O4) environments (ideal tetrahedra) in crystalline quartz-α.
The two sets of Ql's follow a similar trend showing the similarity between the structural units in crystalline and glassy SiO2.
The differences are mostly quantitative and are due to the fact that the Si-O tetrahedra are somewhat distorted in the glass.
|
|
Sébastien Le Roux
2011-02-26