Since version 2.0, I.S.A.A.C.S. offers a curves editing tool which allows to configure the layout of the graphs showing result from the calculations.
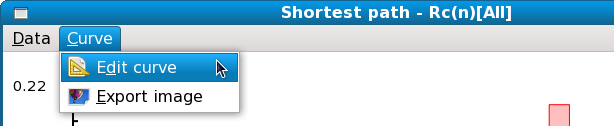
This data plot editing tool is accessible through the 'Curve' menu of any graph window [Fig. 4.25].
Figure 4.25:
The 'Curve' menu of the graph window in the I.S.A.A.C.S. program.
|
|
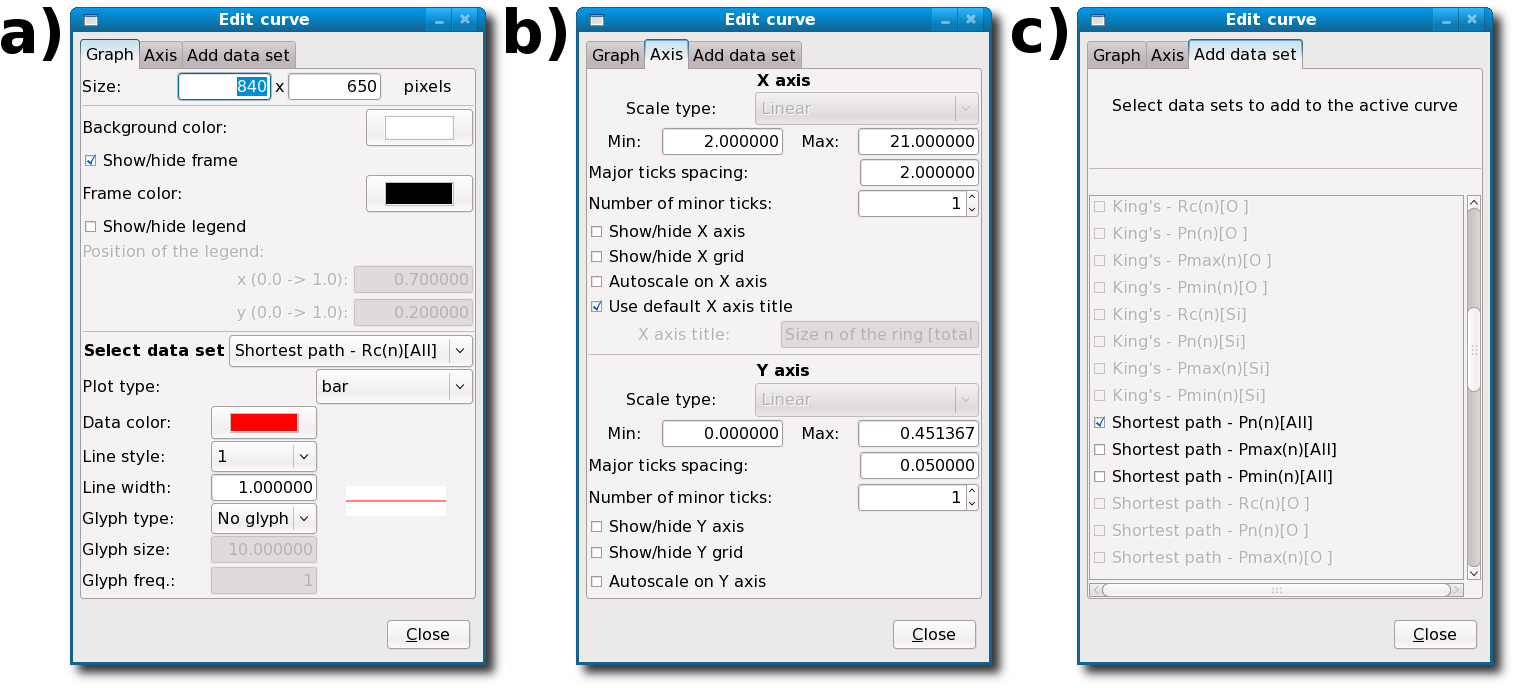
Using the data plot editing tool [Fig. 4.26] it is possible to configure the layout of the selected graph, as well as the layout each data set which happen to be plotted on the graph [Fig. 4.26-a)], it is also possible to configure X and Y axis layout and/or position [Fig. 4.26-b)].
Furthermore depending on the calculation several data sets can be selected and plotted together with the main data set of the active window [Fig. 4.26-c)].
Data plot edition in the I.S.A.A.C.S. program is illustrated with the examples in [Fig. 4.27] and [Fig. 4.28].
Figure 4.26:
The data plot editing tool box in the I.S.A.A.C.S. program.
|
|
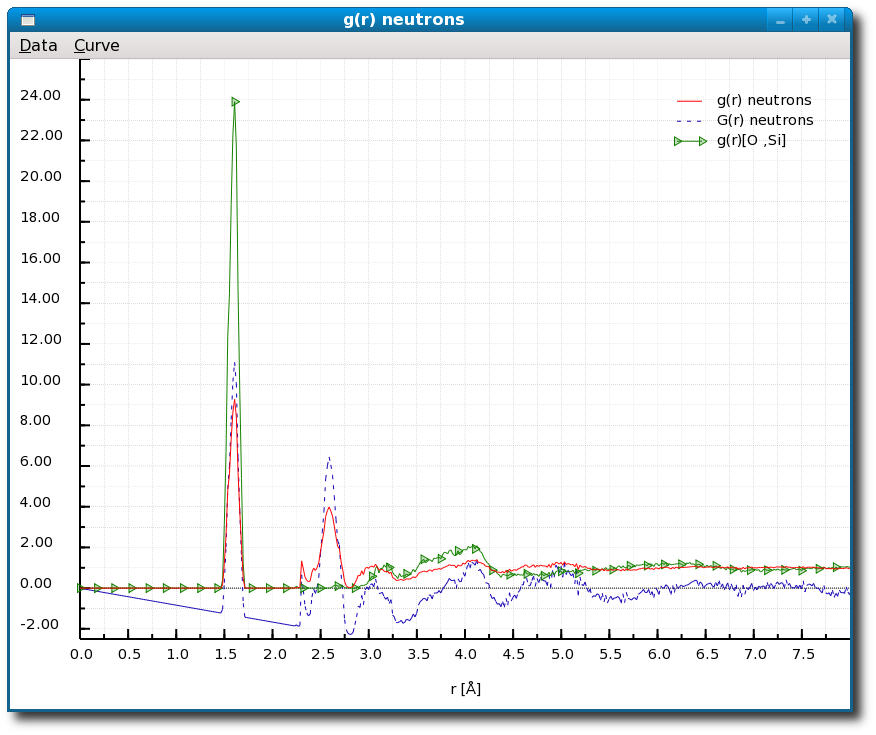
Figure 4.27:
Summary of the results of the calculation of the radial distribution functions for glassy SiO2 by the I.S.A.A.C.S. program: total neutron g(r) and G(r) distribution functions (see Sec. 5.2 and 5.3 for details) as well as partial O-Si distribution function are displayed on the same graph, layout, legend and axis scales are configured
|
|
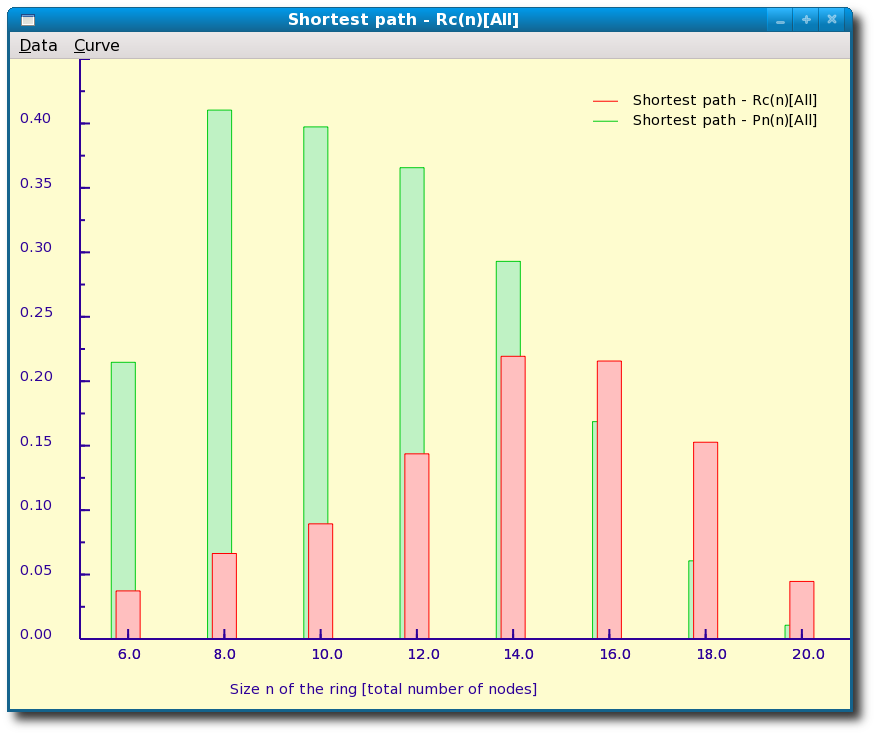
Figure 4.28:
Summary of the results of ring statistics for silica glass as computed by I.S.A.A.C.S.
Rc and Pn for shortest path analysis (see Sec. 5.5 for details) are displayed on the same graph, layout, legend and axis scales are configured.
|
|
Sébastien Le Roux
2011-02-26